


Tracking your website’s search visibility can feel overwhelming, especially when rankings shift and new SERP features appear overnight.
I’ve seen how confusing it gets to separate useful ranking data from endless spreadsheets and jargon. Many marketers and business owners struggle to connect these numbers to real business outcomes.
In this article, I’ll break down what a search engine ranking report actually is, why it matters, and how to use it for practical SEO improvements. You’ll learn the key terms, see examples of actionable dashboards, and get tips for troubleshooting ranking drops and proving ROI.
I’ll also compare leading platforms like SEMrush, Ahrefs, and SEOSwarm, so you can pick the right tools for your workflow. By the end, you’ll know how to turn ranking reports into a decision-making asset for your campaigns.
What is a Search Engine Ranking Report?
Definition and Core Purpose
Search engine ranking reports—let’s break down what they are. These reports present a structured view of exactly where your keywords or website pages sit in major search engines like Google and Bing.
Their main purpose is pretty straightforward: to reveal visibility. They show how your content appears in search results for specific queries, letting digital marketers, SEO specialists, business owners, and consultants track whether strategies are working and how rankings change as time goes on.
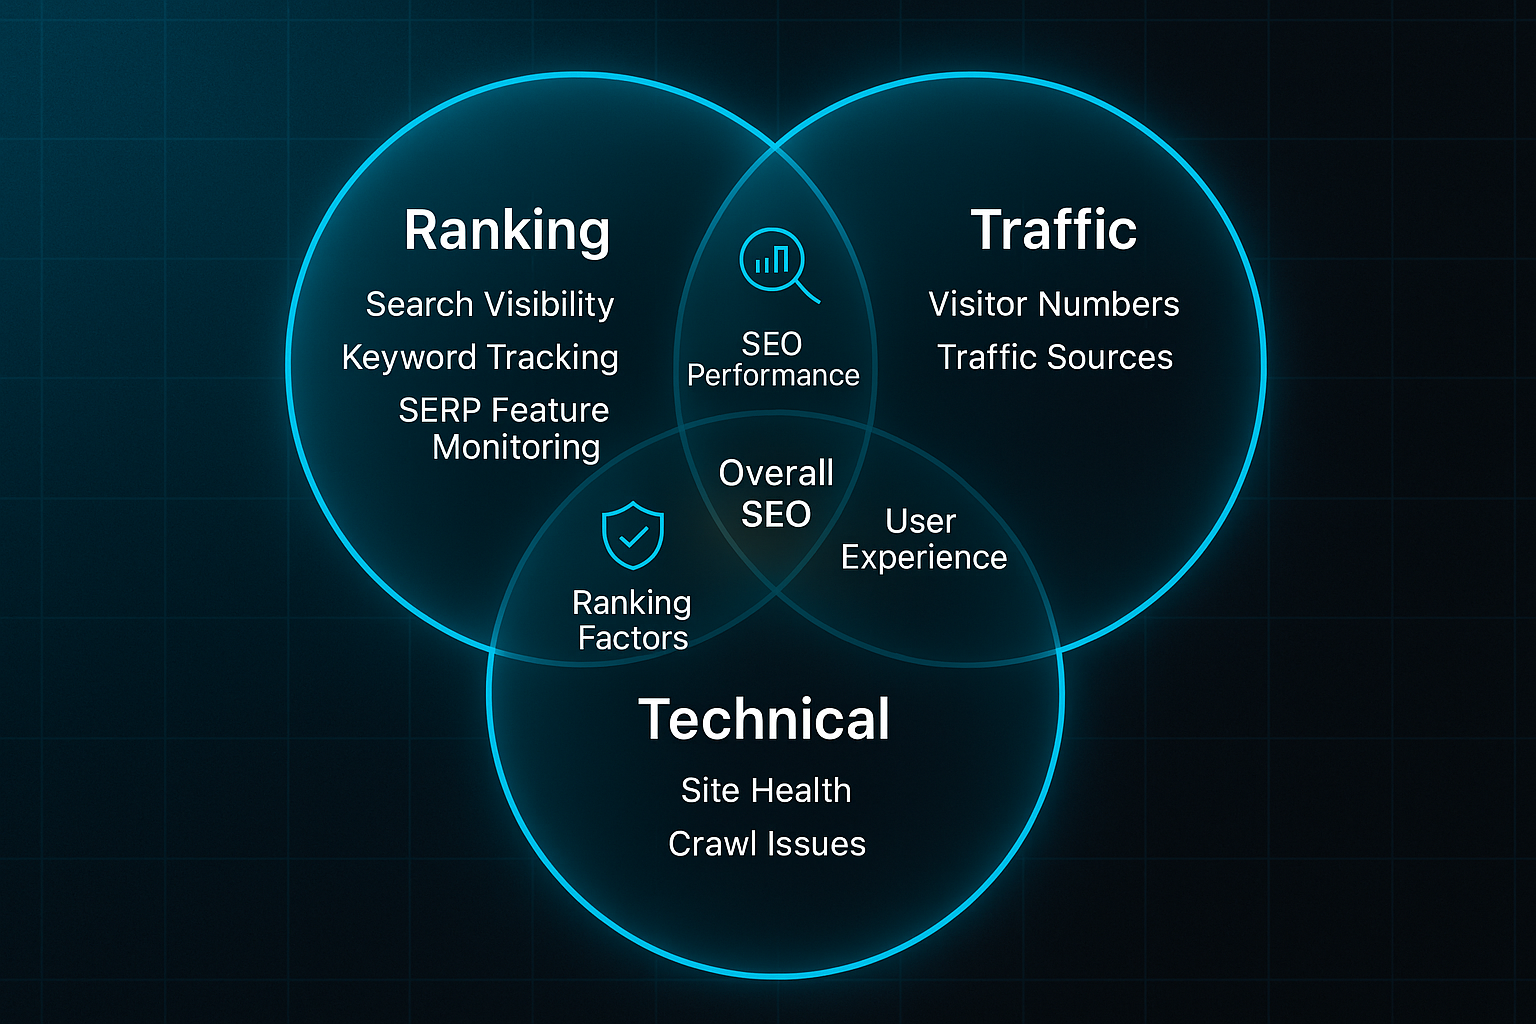
They aren't the same as traffic reports, which highlight visitor numbers, or technical audits, which focus on site health. Ranking reports are all about search visibility: which keywords you're following, your site's standing for those phrases, and how shifts happen after SEO work or wider market changes.
And the format depends on who needs it. Agencies might use live dashboards for instant analysis. Business owners often prefer PDF summaries with just the headline results. Consultants might dig into detailed spreadsheets to filter or segment the data for deeper insights.
Why so many choices? Because different users need different views. Picture an online retailer rolling out eco-friendly shoes and monitoring keywords like “sustainable sneakers.” A dashboard lets them see position changes and track featured snippets as they happen, making reporting fast and relevant.
Key Terminology Overview
Understanding the basic terms is half the battle. Here’s a quick intro before the list: When you get familiar with these, reading ranking reports suddenly starts to make sense and the numbers become useful.
- Keyword
The search phrase tracked for visibility. - Ranking Position
The spot a site holds for a keyword (e.g., #2 for “vegan trainers”). - SERP Feature
Result enhancements like featured snippets, People Also Ask, product carousels, local packs, or AI-generated answers. - Impressions
Number of times a tracked page appears in search results. - CTR (Click-Through Rate)
Percentage of impressions that lead to a visit. - Trend
The pattern or direction of a ranking’s movement over time. - Visibility Score
Summarises how prominent a site is, factoring keyword count, ranks, and search volume.
Getting these terms sorted makes interpreting ranking data and tying it to bigger marketing goals far less overwhelming.
Why Search Engine Ranking Reports Matter
But... why is this kind of report so important?
Top-ranked pages for valuable keywords land the lion’s share of clicks, so tracking positions is a direct measure of the effectiveness of your strategy. Without reliable rank data, you’re working in the dark.
An analysis of 4 million Google search results provides authoritative data on how organic click-through rate (CTR) correlates with ranking position on the search engine results page.
What’s interesting is these reports uncover more than just movement—they can highlight trending rises after optimisation, sudden dips after updates, and unclaimed keyword opportunities. It’s like seeing your entire digital chessboard at once.
Agencies use ranking reports to demonstrate improvement and bolster trust with clear, tangible evidence.
When newer SERP features and AI-driven summaries like Google’s Search Generative Experience appear, organisations rely on robust monitoring to keep up.
Tracking both standard and enhanced positions gives marketers a complete picture and lets them move quickly when the landscape changes.
It's really about maintaining a 360-degree view of visibility—where you stand now, how that’s shifting, and what might spark the next campaign.
Common Challenges and Misconceptions
Anyone managing hundreds or thousands of keywords knows that data overload is real. Sifting through massive lists makes it tough to separate what matters, which means good filtering and smart organisation are vital.
What happens if rankings bounce a little? Many users see a slight dip or jump and panic, but routine SERP volatility is normal. One rhetorical question you might ask: does a one-position slip actually mean lost sales? Not always.
Attributing ranking shifts is tricky too. Is it your competitors ramping up SEO, a change to Google’s algorithm, or something you did?
Linking data to real-world outcomes like leads or purchases isn’t always obvious. It took me a while to realise how many factors can muddle the story.
Without grounding in the terms and context, it’s easy to misread what the numbers are saying—or miss finding those hidden opportunities you want to act on.
But what if you start with a clear understanding? Suddenly, ranking reports become a valuable decision tool rather than a source of confusion.
And if you’re curious how these reports drive marketing transparency and optimise campaigns, that’s exactly what we'll explore in the next section.
Benefits of Using Search Engine Ranking Reports for SEO
Transforming Ranking Data into Actionable Site Improvements
Search engine ranking reports aren’t just for keeping an eye on your positions—they’re a way to turn raw data into next steps that actually move the needle.
That’s where tools like Ahrefs, SEMrush, and SEOSwarm come in. They automate the grunt work of tracking keyword positions and give you a clear view of “quick-win” targets—those keywords hovering just outside page-one status.
SEOSwarm adds something a bit special: it sends alerts when you’re close to cracking top rankings and offers tailored optimisation suggestions right inside the dashboard.
Instead of guessing what’s next, you can zero in on making edits—like tweaking metadata or cleaning up content structure—and measure the difference instantly.
Proving ROI and Building Stakeholder Trust
You need more than technical jargon to convince a stakeholder that SEO matters.
Ranking reports bridge the gap—they transform page positions and keyword shifts into stories about real business impact.
Tools such as Looker Studio, Google Data Studio, and SEOSwarm make this even smoother by scheduling dashboards and visual summaries.
SEOSwarm’s stakeholder reporting module stands out here by offering customisable summaries that align with business targets and reduce manual work for agencies.
So managers don’t have to dig through endless spreadsheets; they get focused reports that actually support investment and strategy decisions.
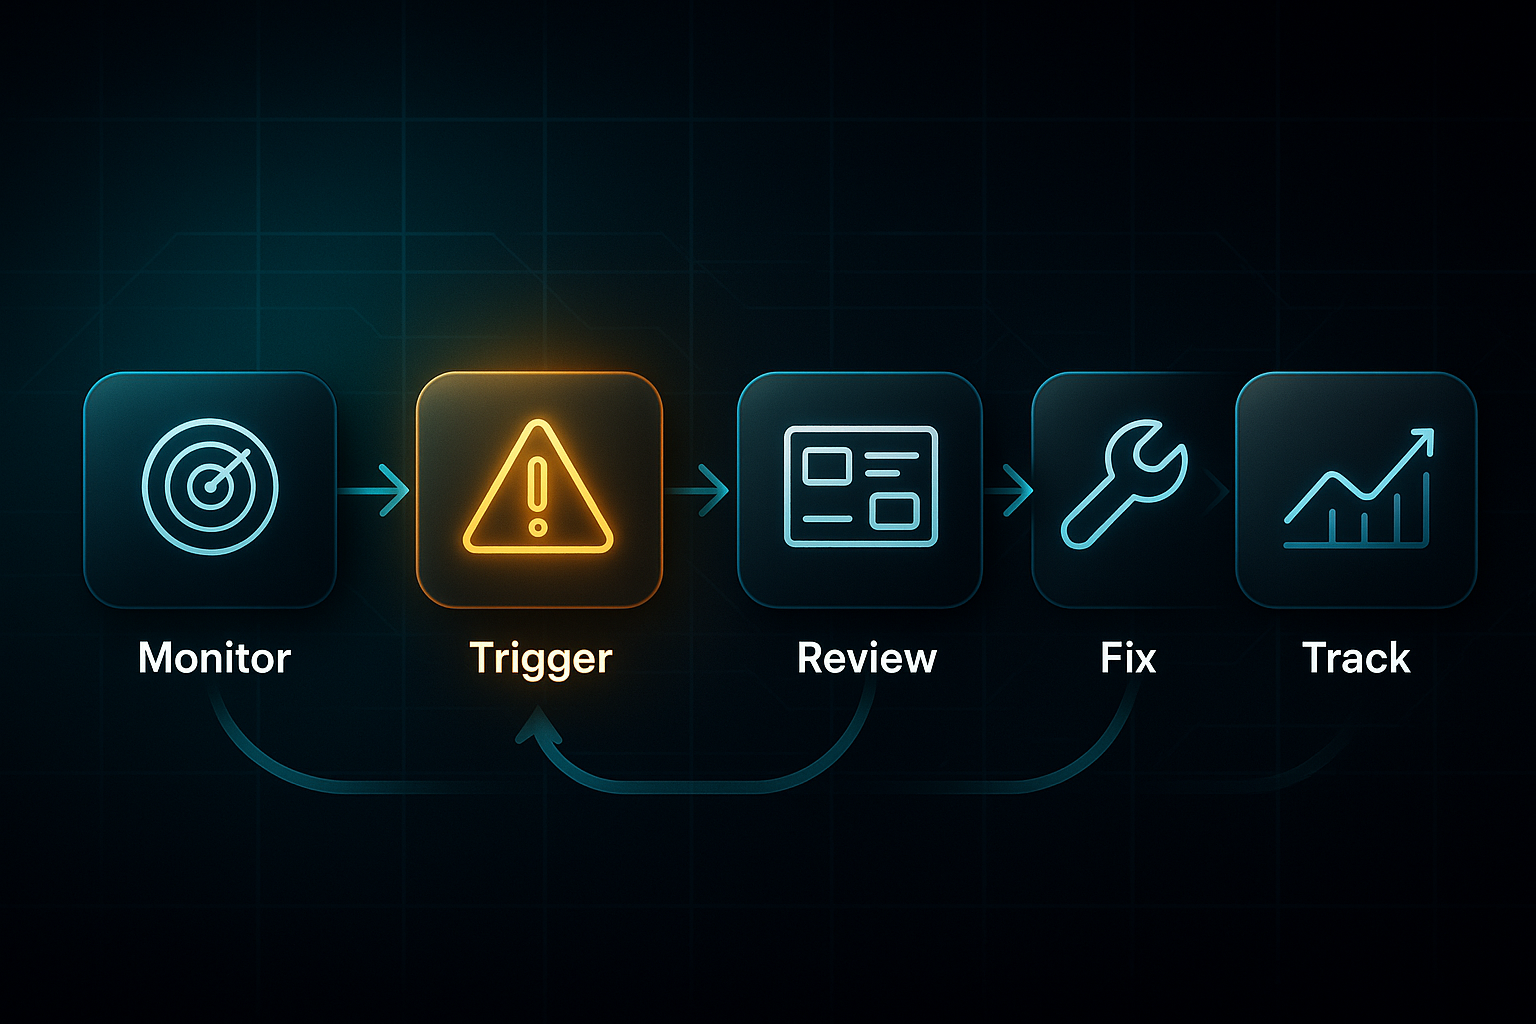
Troubleshooting Drops with Alerts and Automated Workflows
Things go wrong—rankings can dip, often overnight.
Ranking reports make those problems obvious fast.
The better platforms now send instant alerts when important keywords slip, so you can jump on fixes before traffic takes a hit.
SEOSwarm’s agentic maintenance does even more: once it spots a drop, it runs an automatic diagnostic, delivers targeted fix suggestions, and logs every recovery step.
Picture this: a retail user’s rankings drop, SEOSwarm alerts them, they fix a schema error with the built-in editor, and the site’s position bounces back—all tracked and documented, end to end.
Uncovering Growth Opportunities with Gap Analysis
Ranking reports can highlight where competitors are seizing ground—and show you where to push next.
Dashboards in SEMrush and SEOSwarm layer up your tracked keywords with competitor overlays and SERP feature snapshots.
Here’s where SEOSwarm’s automated gap analysis is handy: it spots under-served keywords and auto-generates content briefs via its “blog-in-one-minute” integration.
That means you get new campaign opportunities handed to you, without the slog of manual audits.
Connecting Rankings to Real Business Impact
Top platforms now link rankings straight to traffic and conversions.
For example, SEOSwarm’s reporting shows exactly when “fee-free checking account” jumped from #9 to #3—and how that shift led to a 400% increase in organic visitors and a 240% spike in signups.
In this year, more tools automate those connections, so you can confidently tell the story of SEO in business terms.
Search engine ranking reports aren’t just a box-ticking exercise any more. They’re a platform for direct optimisation, ROI proof, and rapid problem-solving—essential for marketers and owners navigating today’s search landscape.
Now, let’s unpack how these reports are built and which components matter most for your campaigns.

AI-Powered
SEO Content Strategy
See the AI platform that's replacing entire content teams
(with better results).

Essential Components and Templates for Effective Ranking Reports
Must-Have Metrics and Actionable Sections
The most effective search engine ranking reports in 2025 highlight actionable, transparent metrics. Leading platforms like SEOSwarm, SEMrush, and Ahrefs prioritise clear progress indicators instead of overwhelming users with endless columns. These tools focus on the real story your data tells—what’s changed and what should happen next.
- Keyword
The search term being tracked. - Search Volume
Monthly estimated searches for the term. - Current Ranking
Your position in search results now. - Previous Ranking
Where you ranked in the last report (or time frame). - Change in Position
The movement (gain/loss) since last check. - Target URL
The page on your site optimised for this keyword. - CTR (Click-Through Rate)
The percentage of impressions resulting in clicks. - Action Note
A summary of what caused changes and next optimisation steps.
| Keyword | Search Volume | Current Rank | Previous Rank | Change (+/-) | Target URL | CTR | Action Note |
|---|---|---|---|---|---|---|---|
| best project management tool | 14,000 | #4 | #6 | +2 | /project-management | 41% | Jumped into Top 5 after schema update; next: optimise title for SGE (Search Generative Experience). |
Modern platforms track more than just numbers. They now monitor SERP (Search Engine Results Page) features—like Featured Snippets, SGE (Search Generative Experience) overviews, People Also Ask, video/image boxes, and product carousels. These enhancements display as badges or visual columns, bringing SERP context into the ranking data. SEOSwarm, for instance, logs SGE exposure and CTR shifts in real-time, which helps you react as search dynamics evolve.
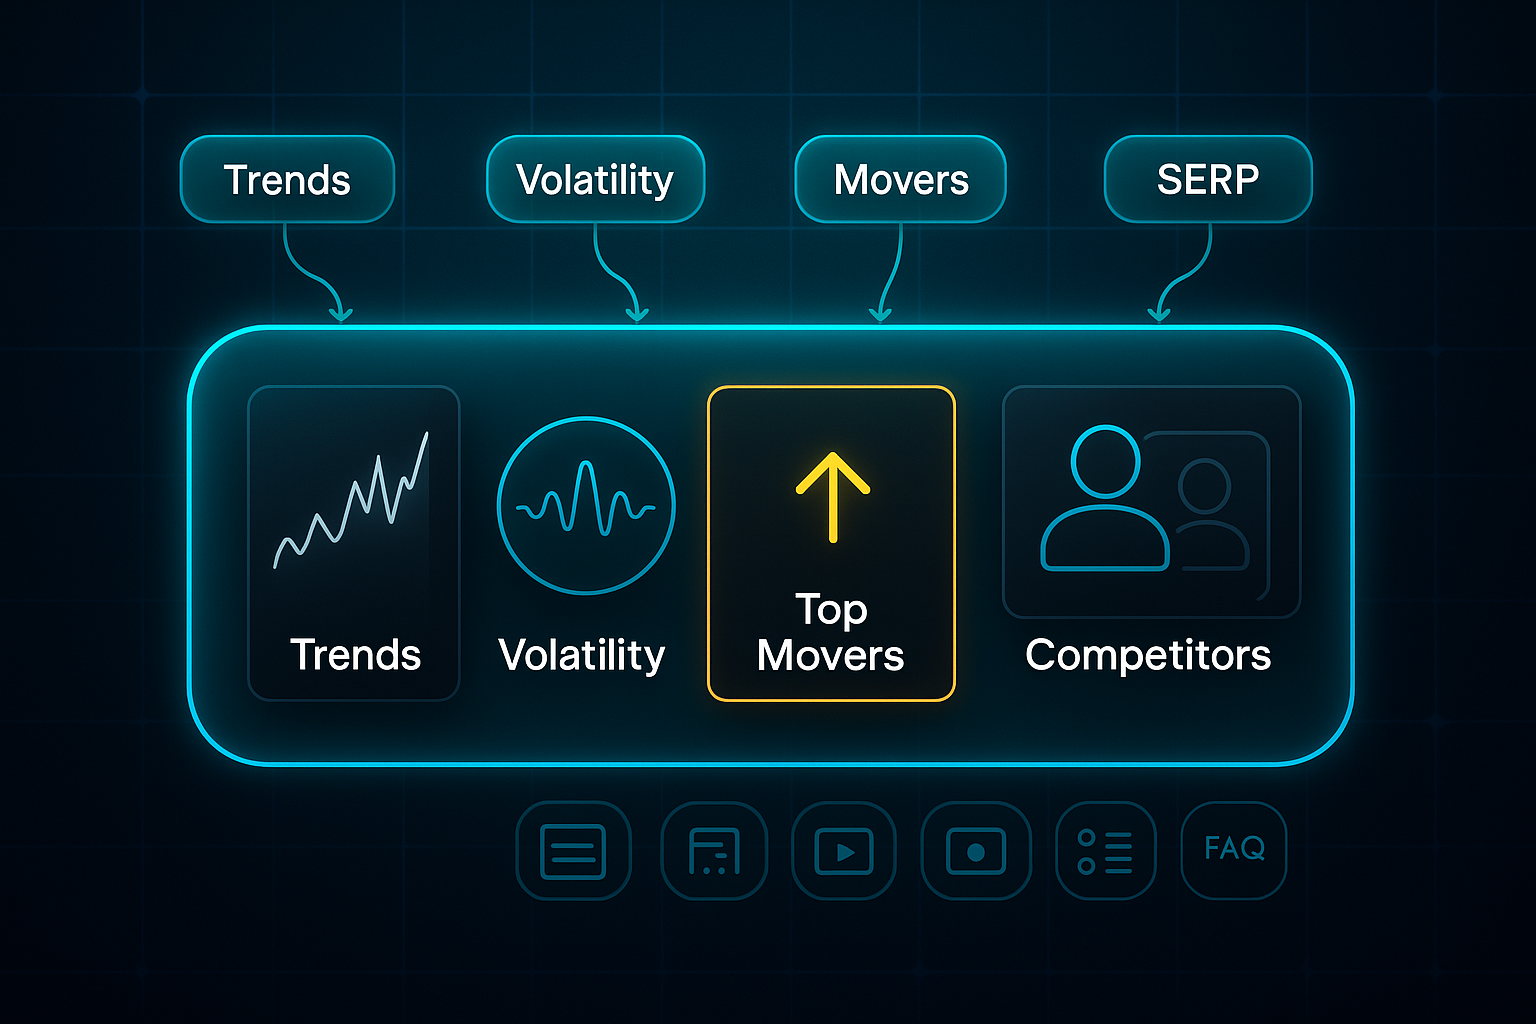
Visual elements are now standard: sparkline graphs, volatility badges, and highlight panels for top movers all improve readability. Tools such as Looker Studio, SEOSwarm, and Google Data Studio allow users to quickly assess which keywords are on the rise, which competitors are making moves, and where new opportunities or risks are emerging.
Advanced Metrics and Emerging Sections
The latest ranking reports incorporate advanced signals for deeper insight. For example, many platforms now include referral statistics from AI and LLM (Large Language Model) tools such as SGE, ChatGPT, and Perplexity. This visibility matters, as AI-driven search tools increasingly shape digital discovery.
User engagement metrics—like average dwell time, bounce rate, and scroll depth—are now layered alongside keyword data. These figures help you judge whether visitors stay and engage with your content, not just land and bounce away.
Technical overlays, including Core Web Vitals (LCP, CLS, INP), are displayed for each tracked keyword. By viewing metrics like LCP (Largest Contentful Paint), CLS (Cumulative Layout Shift), and INP (Interaction to Next Paint) directly in ranking reports, it becomes easier to link site improvements to ranking results. SEOSwarm might show: LCP 1.1s (OK), CLS 0.05 (OK), INP 92ms (pass), right within your keyword table.
To simplify decision-making, action item panels have become a staple in SEOSwarm and SEMrush. These “Next Steps” cards provide tailored prompts, such as “optimise meta for SGE preview box” or “update FAQ schema,” so users move directly from insights to improvements.
Report Templates: Blueprints by Scale and Audience
The way you structure your ranking report should be tailored to your business type and audience. Freelancers and small businesses, tracking fewer than 10 keywords or clients, benefit most from streamlined spreadsheet exports via platforms like Ahrefs or SEOSwarm—focused on essentials and built for quick review.
Agencies or mid-sized teams that manage 10–50 sites utilize dashboards in Looker Studio, SEMrush API, or SEOSwarm’s agentic panels. These platforms integrate executive summaries, SGE and AI statistics, competitor overlays, and technical cards in a single, unified view for swift interpretation and action.
Large organisations, with more than 50 clients or sites, depend on enterprise suites such as SEOSwarm and Data Studio Enterprise or create custom dashboards in Looker Studio. These advanced solutions offer features like domain filtering, widgets for “At-Risk Keywords,” SGE coverage, content decay alerts, and row-by-row technical overlays to manage at scale.
Matching your report layout to the business roles in your team ensures every person has the context and next steps they need. For clarity and effectiveness across common audience types, the following custom dashboard approaches improve both actionability and comprehension:
- Business Owner Dashboards
Condensed cards that highlight organic lead growth, SGE opportunities, and top keyword gains. Automated email summaries or snapshots make reporting fast and relevant for busy owners. - Internal/Technical Views
Panels with overlays for Core Web Vitals (LCP, CLS, INP), SGE win rates, and direct competitor comparison. These views help technical teams resolve site issues quickly and efficiently. - Stakeholder Reporting
Plain-English summaries for management and detailed tactical panels for operations—delivered in language that fits each decision maker.
For ROI and campaign attribution, dashboards from SEOSwarm or Looker Studio now link SEO statistics directly to business impact, such as increased conversions and revenue. Example: “Organic conversions: 348 (+10%), £9,800 revenue. SGE exposure boosted conversion rates by 25%.”
Common Reporting Pitfalls
One major pitfall is failing to track SGE or AI-driven search features. As much as 25–40% of competitive keywords now trigger SGE modules; missing this data means missing out on vital new traffic sources and growth opportunities. While SEOSwarm, SEMrush, and Ahrefs include these metrics, static or older templates may leave them out. Always ensure your report includes this column.
Neglecting technical and context fields can also break the link between site fixes and ranking gains. Omitting Core Web Vitals, site speed, or mobile errors means that actionable opportunities go unnoticed. Likewise, ignoring trend panels or anomaly flags—such as those provided in Looker Studio or SEOSwarm’s Historical Patterns—can cause you to overreact to temporary dips or miss longer-term patterns.
Blueprints for Scalable Modular Reporting
To scale reporting across agencies or multi-site teams, modular dashboards are crucial. SEOSwarm, Looker Studio, and SEMrush Enterprise offer the ability to filter by client, campaign, or timeframe and create panels for weekly keyword movers, SGE/AI wins, technical health alerts, competitor overlays, and actionable to-do lists.
With nightly API-powered updates, your data stays current and summary snapshots are always ready for stakeholder review. Platform tools like SEOSwarm’s audit wizard or Looker Studio’s auto-template function streamline regular dashboard maintenance and rapid portfolio-wide updates.
With these essential components and scalable templates, ranking reports become practical tools to react to key trends, benchmark results against goals, and fuel real action for every business campaign.
Building an Actionable Search Engine Ranking Report: Instantly Deployable Blueprint With Advanced Tactics
Visual Blueprint: Segmented Dashboards and Alert Logic
If you want ranking reports that genuinely influence SEO strategy in 2025, the secret is quick, targeted insight. Instead of static sheets full of numbers, agencies and SMBs (Small and Medium-Sized Businesses) use segmented dashboards that instantly highlight performance shifts and next steps.
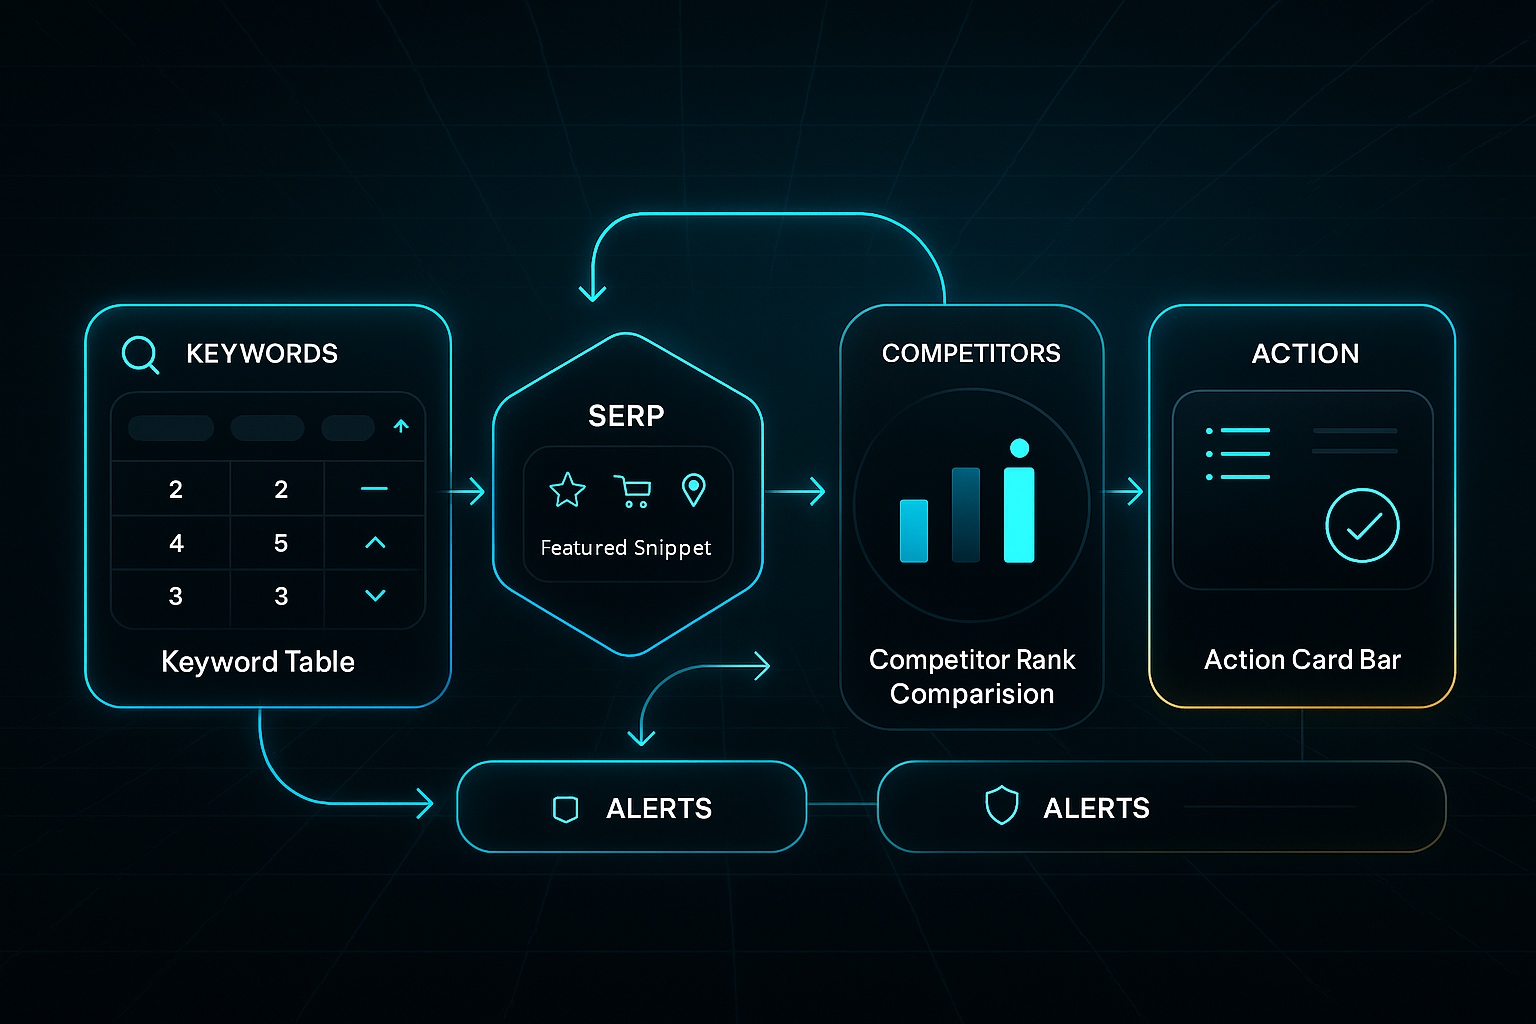
Every effective dashboard shares a common set of fields. You’ll track keyword, current and previous rank, trend arrows showing position change, search volume, and CTR (Click-Through Rate). They also capture tracked SERP (Search Engine Results Page) features like Featured Snippet, Product Carousel, SGE (Search Generative Experience), and Map Pack, competitor ranks for context, and modular action cards that spell out exactly what improvement or repair should happen next.
When choosing a platform—whether SEOSwarm ($99–$499/month.), SEMrush ($119.95–$449.95/month.), AgencyAnalytics ($99–$299/month.), Ahrefs ($99–$999/month.), or Looker Studio (free)—update frequency and alert speed make all the difference.
Top solutions refresh dashboards in real time or within fifteen minutes and push out alerts in under 30 minutes.
To understand how these elements turn numbers into action, consider the following dashboard example.
This table distills how fast decision-makers track campaign progress, spot risks, and trigger fixes—so every change receives immediate attention:
| Keyword | Current Rank | Change | Trend Arrow | CTR (Click-Through Rate) | SERP Feature (Search Engine Results Page feature) | Competitor Rank | Alert Trigger | Action Card |
|---|---|---|---|---|---|---|---|---|
| fee-free checking | #3 → #1 | +2 | ↑ | 22% | SGE (Search Generative Experience) | 2 | Gain snippet | Rewrite meta by 13/11 |
| best running shoes | #12 → #5 | +7 | ↑ | 14% | Product Carousel | 4 | Visibility <65% | Update product schema |
| plumber near me | #9 → #4 | +5 | ↑ | 17% | Map Pack | 3 | Rank drop >3 | Fix local page errors |
See how every row pairs rank movement or SERP feature changes with a specific action—no guesswork, just direct impact.
Modern dashboards rely on automated alert logic, which brings instant reactivity.
You set up custom triggers: if rank drops by more than three positions, a SERP feature (Search Engine Results Page feature) is lost or gained, CTR (Click-Through Rate) falls below 10%, or visibility drops under 70%, your team gets notified right away.
AI-powered platforms such as SEOSwarm and SEMrush spot anomalies and send out alerts via app, email, or text, often within 15 minutes—allowing fixes before any real harm is done.
By proactively detecting anomalies in key metrics, such as a drop in website traffic or a spike in bounce rate, marketing teams can shift from a reactive to a proactive stance, addressing issues before they escalate.
But which metrics matter most for staying competitive day-to-day? The technical routine below pinpoints exactly what to track.
Setting these up helps you detect changes early, target improvements, and log all responses for transparency.
Each bulleted point directly supports ongoing SEO health, forming the backbone of reliable, actionable reporting.
- Technical Alert KPIs (Key Performance Indicators)
Spot rank drops >3 positions/week, CTR (Click-Through Rate) under 10%, gained/lost SERP features (Search Engine Results Page features), or visibility slips under 70%. These metrics highlight urgent issues or hidden opportunities. - Review/Audit Cadence
Agencies commit to daily dashboard checks, quarterly deep audits, and monthly crawl reviews to minimise risk. SMBs see best results from month-by-month dashboard reviews and focused quarterly technical sweeps. - Incident Log Fields
Every fix should be logged with timestamp, keyword, issue, business impact, resolution, owner, and before/after stats. This ensures that every change is documented and measurable—for compliance and ongoing improvement.
Establishing these routines lays the foundation for consistent performance and effective reporting practices. This foundation naturally extends into the stakeholder-facing dashboards described next.
Stakeholder Dashboards and Action Card Templates
Effective dashboards transform with the audience, making actionable insight available to every role.
Agencies get overlays for multiple clients, combining campaign data, trend arrows, KPIs (Key Performance Indicators), suggested actions, and comprehensive incident logs.
SMBs rely on streamlined views: business name, spotlight KPIs, and card-based direct prompts (“Add FAQ schema for keyword X by DD/MM”; “Review meta if snippet lost”).
Executives get top-line summaries—“Organic conversions: +31%, revenue: £24,100, SGE (Search Generative Experience) driving 21% more leads”—plus trend indicators to identify gains and losses quickly.
SEO leads need campaign dashboards rich with granular detail: technical overlays, anomaly detection, and action logs showing every fix by owner and due date.
Examine the table below to see how tailored dashboard templates support each persona.
By matching dashboard design with specific operational needs, teams ensure every user acts with speed and confidence:
| Persona | Summary Card | Key KPIs (Key Performance Indicators) | Trend Arrow | Action Panel | Incident Log |
|---|---|---|---|---|---|
| Executive | Revenue, conversion trend | Organic conversions, revenue, traffic growth | ↑/↓ | Next Step cards: Fix, rewrite, expand | Green tick/completed |
| Agency | Client, campaign, alerts | CTR (Click-Through Rate), visibility, keyword wins | ↑/↓ | Next Step cadence; fix by DD/MM | Resolution, timestamp |
| SEO Lead | Campaign, tech overlays | Rank, bounce rate, page speed | ↑/↓ | Action/fix queue; owner assignment | Log: owner/status |
Notice how the dashboard provides actionable direction and a clear workflow—whether you manage strategy, operate accounts, or oversee technical fixes.
Completed work shows as green ticks, pending jobs get orange flags, and anything overdue flashes red.
This creates confidence in progress and accountability at every operational layer.
Agentic workflows—automated task assignments and status logging built into platforms like SEOSwarm—make these dashboards even more effective.
Teams using this approach commonly report 40% fewer technical issues and 25% faster optimisation after implementation.
When dashboards drive purposeful changes, the impact is tangible.
For example, updating local page and map details for “plumber near me” increased rankings from #9 to #4 and boosted organic leads by 200%.
Tweaking “fee-free checking” for an SGE (Search Generative Experience) snippet took one client from #3 to #1 and more than doubled traffic—a 168% uplift.
Automating Report Generation: Agentic Maintenance Workflows
Bringing it all together is about putting reporting on autopilot.
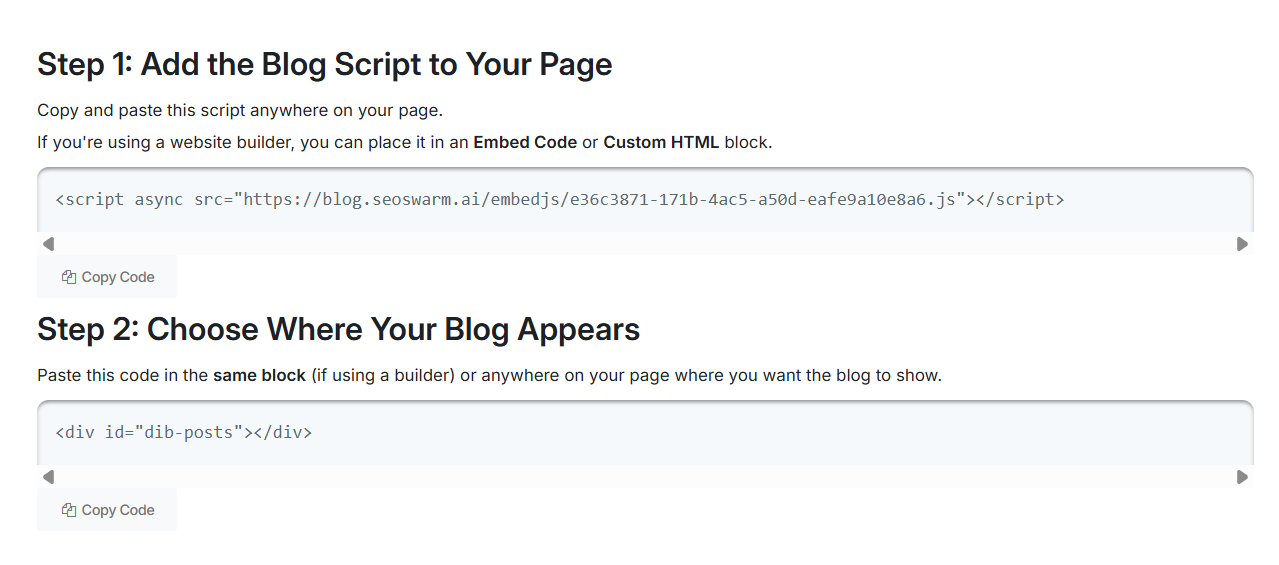
With today’s platforms, you can set up dashboards with just two lines of code.
Then weekly 32-point technical audits, monthly crawls, and constant anomaly scans run automatically.
Any detected issue triggers instant logging and recommended task cards.
This assigns the right fix to the right person and ensures workloads are distributed efficiently.
Status updates are tracked in real time—completed jobs go green, active tasks orange, and overdue ones red.
Dashboards refresh every ten minutes on leading platforms. Teams react to alerts in less than half an hour—so issues are solved before they become costly.
For instance, after fixing mobile usability, a bounce rate dropped from 62% to 41%. This resulted in 1,600 additional annual leads.
In short, when you merge modular dashboards, regular audits, targeted action cards and agentic workflows, your ranking reports become the operational engine for growth.
They are never just a box-ticking exercise.
Embed this blueprint and your next campaign report won’t just measure progress—it’ll guide every strategic action for measurable SEO impact.
Blog-in-one-minute
Add a fully SEO-optimised blog to your website with just 2 lines of code.
Learn more
Using Ranking Reports for Ongoing SEO Strategy and Troubleshooting
Continuous Optimisation: Stepwise Workflows for Agencies and SMBs
Successful SEO isn’t about set-and-forget. It’s about continuously turning ranking reports into a living strategy—keeping you ahead of the game month after month.
The process kicks off with automated reports from platforms like SEMrush and SEOSwarm (our own solution). These reports pinpoint shifts in your rankings, spotlight new SERP (Search Engine Results Page) feature wins, and highlight traffic patterns that matter.
Agencies break down keywords by intent, relying on SEMrush’s Position Tracking dashboard to monitor how their rankings move and stack up against competitors.
Over on SEOSwarm, you’re working with Ranking Trends panels showing every precise movement, SERP Feature Alerts flagging AI summary changes, and Content Gap features revealing untapped opportunities.
For SMBs, the journey is simplified with presets and Quick-Win filters so the most valuable tweaks jump out fast.
Alert logic is the unsung hero here. Don’t wait for slow decline—set your tools to notify you if you lose more than three positions for a keyword, drop a key SERP feature, or see a severe fall in traffic.
SEMrush’s Change Alerts and SEOSwarm’s Automated Insights keep you in the loop, with instant mobile or email notifications. You’ll find issues and fix them in hours—not days.
Troubleshooting Ranking Drops: Rapid Diagnosis and Action
No one enjoys seeing a ranking drop. The real trick is diagnosing problems fast using coordinated audits.
Start by cross-checking your dashboard data with technical audits—SEMrush’s Site Audit tool and SEOSwarm’s automated crawl can spot everything from schema errors to slow load times.
Look for root causes by exploring fresh content gaps, monitoring competitor moves, and inspecting your backlink profile.
Prioritise fixes for pages with the highest potential—think lead magnets and major conversion gateways.
Once the issues are prioritised, agency setups rely on structured ticketing to keep fixes organised.
SEOSwarm’s Change Log assigns and tracks tasks, and SEMrush’s logs let teams monitor progress.
Every fix is followed up after seven days to measure the impact.
Smaller teams or solopreneurs often use manual logs or built-in platform prompts, keeping things lean and manageable.
Driving Outcomes: Conversion and Revenue Attribution
Here’s the big payoff—turning rankings into real business impact.
Modern dashboards, from SEOSwarm to Google Analytics 4 (GA4), map ranking trends right alongside conversion and revenue data.
By setting up widgets for tracked keyword events and sales outcomes, you see the true value of each SEO lift.
For instance, after a targeted optimisation, B2B agencies might see 15–30% traffic recovery and a 20% jump in demo requests within just two months.
Dashboards make these wins visible to execs and clients: concise summaries connect the dots between ranking changes and ROI.
With SEOSwarm’s agentic maintenance, ongoing updates, optimisations, and follow-ups happen all in one workflow.
Case Study: Real-World Impact
Let me show you what this looks like on the ground.
A retail client lost six top-ten rankings after competitors refreshed their content.
The agency jumped on SEMrush’s Change Alerts and SEOSwarm’s Content Gap module, found pages needing updates, and rolled out new FAQs and improved schema.
Within three weeks, four rankings returned—and organic sales rose by 22%.
That’s how actionable ranking reports fuel both tactical fixes and measurable business outcomes.
Turning ranking reports into an SEO nerve centre means ongoing success and resilient troubleshooting. Next up, we’ll compare top reporting platforms so you can choose the best fit for your workflow.
Tools and Platforms for Ranking Report Creation and Automation: A 2025 Decision Guide
Feature, Pricing, and Automation Snapshot: Top Platforms
Your choice of search engine ranking report platform in 2025 shapes everything from how quickly you recover lost spots to how effortlessly you scale campaigns.
Stuck with slow onboarding or weak automation? You’ll spend more time scrambling than strategising. But strong automation and fast setup let you act on ranking shifts in minutes—maximising every SEO opportunity.
Let’s lock in the basics. The SERP (Search Engine Results Page) is where your search fate is decided. API (Application Programming Interface) lets tools talk and automate reporting, freeing your team from manual drudgery.
SGE (Search Generative Experience) is Google’s AI-powered summaries now filling the SERP. Agentic solutions assign, log, and track SEO work autonomously. Incident logging means issues found in your report trigger remediation and documentation automatically—no missed follow-up.
Here’s a quick-look table of leading platforms, covering price, scale, speed, and when each fits best:
| Platform | Pricing | Keyword Capacity | Refresh/Alert Speed | Onboarding Time | Automation/API | Best Fit | Limits |
|---|---|---|---|---|---|---|---|
| SEMrush | $139.95 to $499.95/month | 2,500 to 25,000 | 15 minutes real-time, email, API | 5 to 15 minutes site onboarding, 1 to 4 hours bulk | Alert and report automation, API | Large agencies, teams | High cost, slower bulk setup |
| Ahrefs | $129 to $14,990/year | 750 to 10,000+ | Hourly to daily, email, API | 10 to 20 minutes site, 1 to 2 hours or more bulk | Audit, log, alerts, API | Technical, backlink focus | No instant alerts |
| Moz Pro | $99 to $599/month | 300 to 4,500 | Daily to weekly, API for Medium+ plans | 10 to 30 minutes site, 1 to 2 hours bulk | Reporting and log automation | SMBs, beginners, local businesses | Slow real-time or incident logs |
| SE Ranking | $65 to $229/month | 500 to 20,000 | Hourly to daily, email, API | 5 to 15 minutes setup, API 1 to 2 hours bulk | Automation, logs, API | SMBs, scaling teams | API needed for scale |
| AccuRanker | $99 to $399/month | 1,000 to 100,000+ | 1 to 2 minutes real-time, instant API | 5 to 10 minutes site, 1 hour per 5,000 bulk | API, instant logging, real-time updates | Agencies, alert-driven operations | Needs extra audit tool |
| Mangools | $49 to $199/month | 200 to 1,500 | Daily only, no API | 5 to 10 minutes setup, 1 hour or more for 700+ keywords | Dashboards, simple automation | Freelancers, very small teams | No advanced automation |
| Google Search Console | Free | Unlimited | Daily, 1 to 2 days lag, API or manual | 5 to 10 minutes per property | Basic API, manual reporting | Site owners, DIY | No alerts or automation |
| SEOSwarm | From $49/article, custom pricing | Unlimited via API and Google Search Console | Real-time (2 to 5 minutes), agentic logging | 10 to 20 minutes bulk, 18 or more sites in under 30 minutes | Agentic, end-to-end automation | Mass deployment agencies | Unique: agentic onboarding |
Each solution has its strengths.
SEMrush is ideal for agency-scale campaigns—quick for small jobs, but expect wait times when onboarding huge portfolios.
Ahrefs wins on technical SEO and backlinks, but it isn’t built for rapid-fire incident response.
Moz Pro and Mangools keep small businesses competitive, but you’ll reach platform ceilings if your business grows.
SE Ranking is a solid pick for most SMBs until client numbers or keywords surge, demanding more automation.
Google Search Console is an absolute must for auditing and monitoring, though on its own lacks automation.
SEOSwarm is built for mass, agentic automation—enabling instant onboarding, live logs, and portfolio-wide workflow, no matter the client count.
Platform Fit in Real Agency and SMB Scenarios
Here’s where matching platform and use-case becomes mission-critical. Choosing the wrong platform almost always results in missed SEO wins, wasted hours, and workflow confusion.
The right fit makes high-impact optimisation routine, not an exception. Think of the difference: a freelancer using an enterprise platform wastes time and cost, while a growing agency on small tools drowns in manual chores.
Map your platform to your business model, or you risk lost rankings, delayed fixes, and frustrated clients.
- Freelancer, under 100 Keywords
Mangools is ideal up to 500 keywords; beyond that, manual work swamps you—upgrade to AccuRanker or SEMrush. - SMB or Small Team, 500 to 2,000 Keywords
SE Ranking is easy for moderate growth; as campaigns or clients increase, SEMrush or SEOSwarm unlock scale and automation. - Agency, 2,000 or more Keywords, Automation-First
SEMrush Guru handles reporting at volume, but AccuRanker and SEOSwarm enable bulk onboarding and smart automation—crucial to avoid workload backlogs. - Large or Distributed Agency, 50 or more domains
SEOSwarm powers mass portfolio onboarding, automated logs, and rapid fixes. Slower solutions here mean lost rankings and overworked teams.
Workflow Outcomes and Tangible Benefits
Matched correctly, your platform handles onboarding in minutes, not hours. Incident response becomes routine, not a stressful fire-drill.
With SEOSwarm, setting up 18 client dashboards can save three hours over manual SEMrush imports.
AccuRanker’s two-minute keyword alerts, combined with auto-logging, let teams act on problems instantly.
Key metrics: fast dashboard refresh, immediate action-card response, and less time spent on routine checks.
Agencies report 22 to 34 percent traffic lifts after fast diagnostics and up to 80 percent less manual reporting.
When your dashboard flips from red to green, you know reporting is finally working for you.
For technical SEO and campaign-scale troubleshooting, SEMrush and AccuRanker lead.
For genuine automation and agency expansion, SEOSwarm stands ahead.
Next up, we’ll see how SGE and AI analytics are set to update the agency reporting playbook.
The Future of Search Engine Ranking Reports: Tactical Trends and Adaptation Strategies for 2025+
Tracking AI Overview (SGE) and Brand Visibility
So, here’s what’s happening as we move deeper into 2025—about one in three Google keywords now bring up Search Generative Experience (SGE) and AI Overview panels. If you’re in business or tech, it’s even bigger, topping 35%. Ranking report platforms like SEMrush and our own SEOSwarm have jumped ahead, adding real-time AI Overview widgets and smart trend graphs.
SEOSwarm’s dashboard lets you track how often your keywords appear in AI panels, keep an eye on your own brand as well as competitors, and get instant alerts whenever something shifts.
Agencies use these insights to measure portfolio share for keywords surfacing in generative answers—no more flying blind.
The big result? When brands update their schemas and recapture AI summaries, they’ve seen 18% traffic recovery in just ten days.
Automation and Agentic Dashboards Drive Efficiency
Now, agentic dashboards are changing the game for SEO teams. SEOSwarm and SEMrush set the standard by automating daily crawls, triggering instant action cards for any technical or content issue they spot, and updating dashboard status colours (red, green, orange) as fixes happen.
Don’t overlook the power of single-click onboarding, either.
That’s how one agency migrated 18 dashboards in 25 minutes with SEOSwarm, saving five hours and slashing incident response turnaround by 34%.
AccuRanker stands out too; their anomaly alerts mean 83% less manual monitoring.
For most clients surveyed, automation saves over 12 hours each week and delivers up to an eye-catching 748% increase in campaign ROI.
Adapting to API and SERP Volatility
Google keeps everyone guessing with core updates, and the new top-10 result cap from March 2025 has forced a rethink on SEO tactics. Now, success hinges on entity presence and brand mentions, far more than position numbers alone.
Tools like Screaming Frog and SEOSwarm get agencies back on track when visibility drops, by picking up lost citations, regenerating schemas at scale, and logging every fix.
Speed matters—a rapid schema update log can restore entity presence for 37% of keywords in under three weeks.
Now, tracking brand mentions within AI Overviews is a direct ROI metric, sometimes even more meaningful than old-fashioned rankings.
Given these advances, here’s a snapshot of how these tactical workflows stack up, showing key features and the kind of impact you can actually expect:
| Area | Platform/Feature | Workflow Example | Measured ROI/Impact |
|---|---|---|---|
| AI Overview Tracking | SEOSwarm AI Widget | Track keyword triggers, citation rates, alerts | 18% traffic recovery after schema fix |
| Automation | SEOSwarm Agentic Dashboard | Bulk onboarding, action cards, real-time log | 12+ hrs/week saved, up to 748% ROI |
| SERP Volatility Adaptation | Screaming Frog + SEOSwarm | Audit, bulk schema update, entity recovery log | 37% keyword inclusion recovery in <3 wks |
| Incident Response | AccuRanker | Anomaly alerts, auto-assigned fixes | 83% less manual checking, 34% faster fixes |
As the table demonstrates, the tactical adaptation made possible by these platforms offers substantial workflow improvement and concrete business impact. For decision-makers, the conversation is shifting—from chasing old ranking numbers to chasing presence in generative panels, branded citations, and automated control.
The most effective platforms put agentic dashboards, SGE tracking and instant reporting front and centre, so teams aren’t just monitoring—they’re staying ahead as AI rewrites search visibility and campaign success.
This fast-changing search environment means that, as zero-click queries and AI-driven results become the standard, futureproof SEO reporting truly begins here.
Making Your Search Engine Ranking Report Actionable
Ranking reports aren’t just data—they’re your early warning system and roadmap for real SEO progress. I’ve seen too many teams drown in numbers or chase every ranking blip, only to miss the bigger picture: actionable insight beats raw metrics every time.
Here’s my advice: set up dashboards that highlight what matters, automate alerts for critical shifts, and always connect ranking changes to business outcomes. Don’t just track positions—log every fix, review results, and use action cards to keep improvements moving. The most resilient teams treat ranking reports as a living workflow, not a static report.
If you want your SEO to drive real growth, make ranking reports the engine behind every decision. The difference between confusion and clarity is how you act on what you see—so let your reports guide you, not just inform you.
- Wil